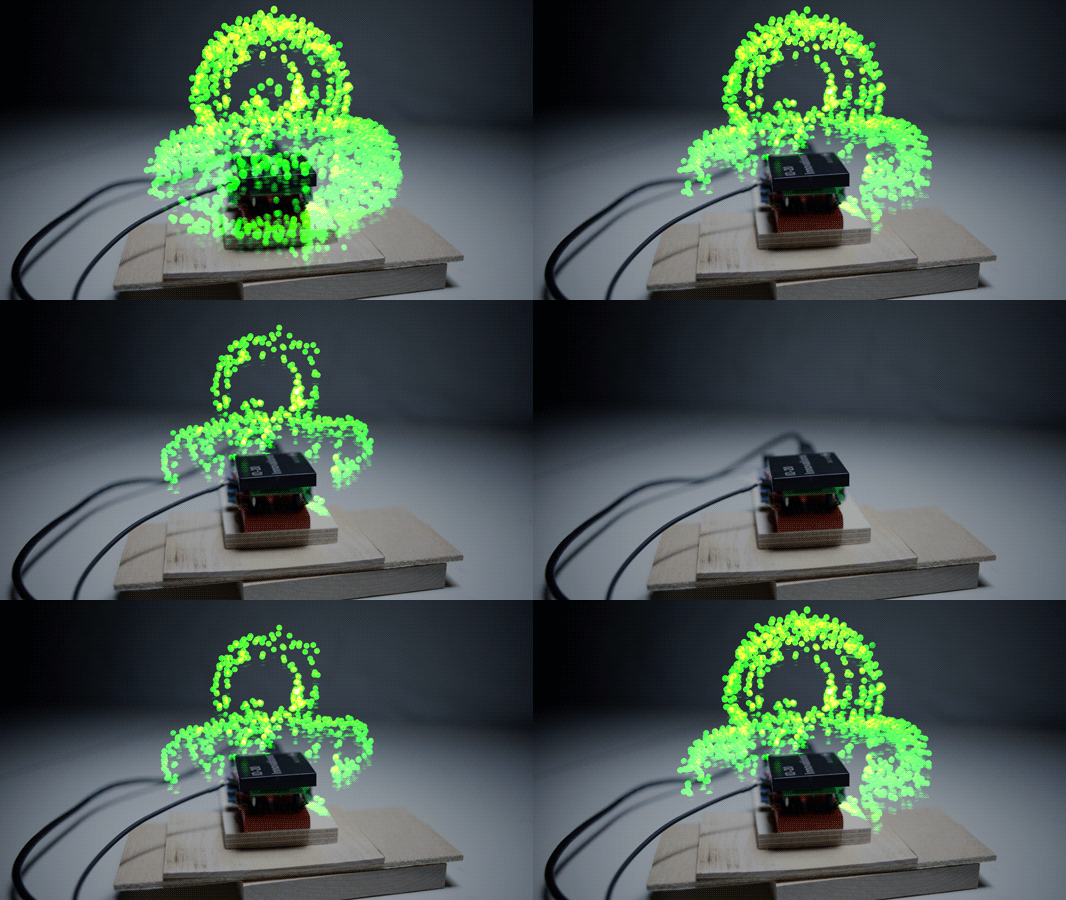
These guys over at Berg London did a really smart thing. They used an ID-20 reader module to kick out a signal to an LED when a tag is read, then put that LED in the center of the tag being read. Then they used some standard photography tricks to capture and superimpose all the “tag read” signals (LED blinks) to show the shape of the periphery of the readable range for the tag in question. When all is said an done, you get a really nice understanding of what that looks like.
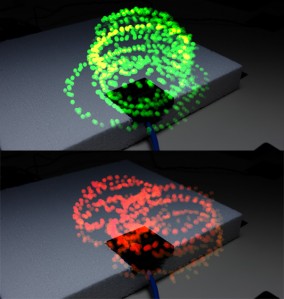
One of the important things I think they illustrate is the way the readable field changes according to tag orientation. Here is an example of using the same tag to map out the readable field in different orientations. The green map was created with the tag held parallel with the reader’s antenna, while the red map was created with the tag held perpendicular.
Here’s a pretty sweet video that explains how and what they did. Too bad they didn’t try a cylindrical tag (glass tag) with a flat reader antenna, or a cylindrical tag with a cylindrical reader antenna. I’m sure they’ll get around to it eventually though.
Immaterials: the ghost in the field from timo on Vimeo.
Tags: photography, range, rfid


Hey, this was actually a collaboration between the Touch project and Berg London .
Ahh my mistake. Thanks Timo for correcting that oversight 🙂
[…] Gizmologia, Influxinsights, io9, Wired, Microsiervos, Make Magazine, WonderHowTo, Gizmodo (FR, JP), Amal Graafstra, William Gibson and Warren Ellis amongst many others. Thanks for all the input and […]
[…] io9, Wired, Gizmodo (FR, JP), Microsiervos, Make Magazine, Gizmologia, Influxinsights, WonderHowTo, Amal Graafstra, William Gibson and Warren Ellis amongst many others. Thanks for all the input and […]
[…] (FR, JP), Microsiervos, Make Magazine, Gizmologia, Influxinsights, WonderHowTo, Amal Graafstra, William Gibson and Warren Ellis amongst many others. Thanks for all the input and […]